Tool · CAPE ratio
What a decade did from here
The CAPE ratio is 40.10 as of June 2026, the 99th percentile of 145 years. Set an amount and move the slider to see what the next ten years returned from a reading like that.
What a decade did from here
From a CAPE of over 30, the median of 56 historical decades returned -1.27% a year after inflation, with dividends reinvested. This is what happened, not a forecast.
Where the 56 decades in this band landed
Every month since 1881 is sorted by the CAPE it started at, then measured against the real total return of the following ten years, dividends reinvested and inflation removed. No tax, trading cost or adviser fee is applied, so a real outcome is worse than these figures by whatever those cost you. Past performance does not predict future results.
Download the datasetRead this before you trust the number
This is a lookup, not a projection
A normal retirement calculator takes a return assumption, compounds it, and prints one confident figure for ten years out. The assumption is where all the work happens and it is usually invisible. This one makes no assumption at all. It finds every month since 1881 that began at the valuation you selected, measures what the next ten years actually returned after inflation with dividends reinvested, and reports the middle of that group along with the two ends of it.
That is why the worst case sits next to the median at the same size rather than in a footnote. From today's reading of 40.1 the band holds 56 months, the median decade returned -1.27% a year, and the worst returned -5.9%. A calculator that showed you only the first of those three numbers would be selling something.
The relationship is real and it is loose. CAPE has explanatory power over a decade and close to none over a year, so nothing here is a reason to move money this week. Sample sizes differ a great deal between bands, the expensive end is drawn from a small number of episodes, and the bands do not form a clean ladder. All of that is on the full tracker page with the chart and the dataset.
Cheapest band on record
+11.0%A year real, across 226 months starting under 10. Every one of those decades beat inflation.
Where we are now
-1.3%A year real, across 56 months in today's band. 39% beat inflation.
What it cannot do
Tell you about next year, price any individual holding, or account for tax, fees and spread. Real outcomes come in below these figures by whatever those cost you.
How to use it
Three inputs, and what each one changes
The amount is a lump sum held for the whole period with nothing added and nothing taken out. It scales everything linearly, so it changes the dollars on the panel and none of the percentages. If you contribute monthly rather than once, your outcome sits closer to the middle of the range than the figures here, because regular buying spreads you across many starting valuations instead of one.
The CAPE slider is the input that does the work. It selects which historical months the calculator looks at, and every figure on the results side is drawn only from months that began in that band. Drag it down toward 10 and you are asking what happened to people who bought after a crash. Drag it up past 30 and you are asking what happened to people who bought near a top. The sample size under the slider tells you how many months you are averaging, and it varies from a few dozen to several hundred.
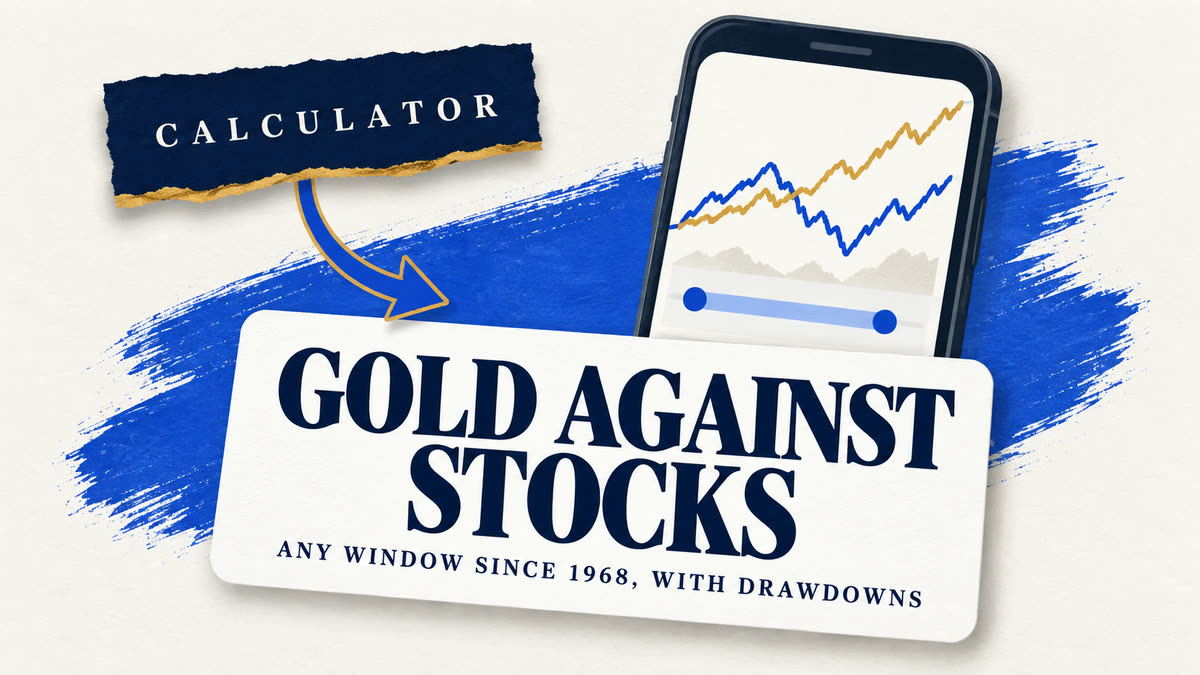
The horizon is fixed at ten years and that is deliberate rather than a limitation. CAPE has meaningful explanatory power over a decade and very little over one year, so offering a one-year setting would invite readers to use the tool for the single thing the evidence says it cannot do. If you want a different window, the gold vs stocks backtest runs any start and end year you choose.
The measure itself
What the CAPE ratio measures
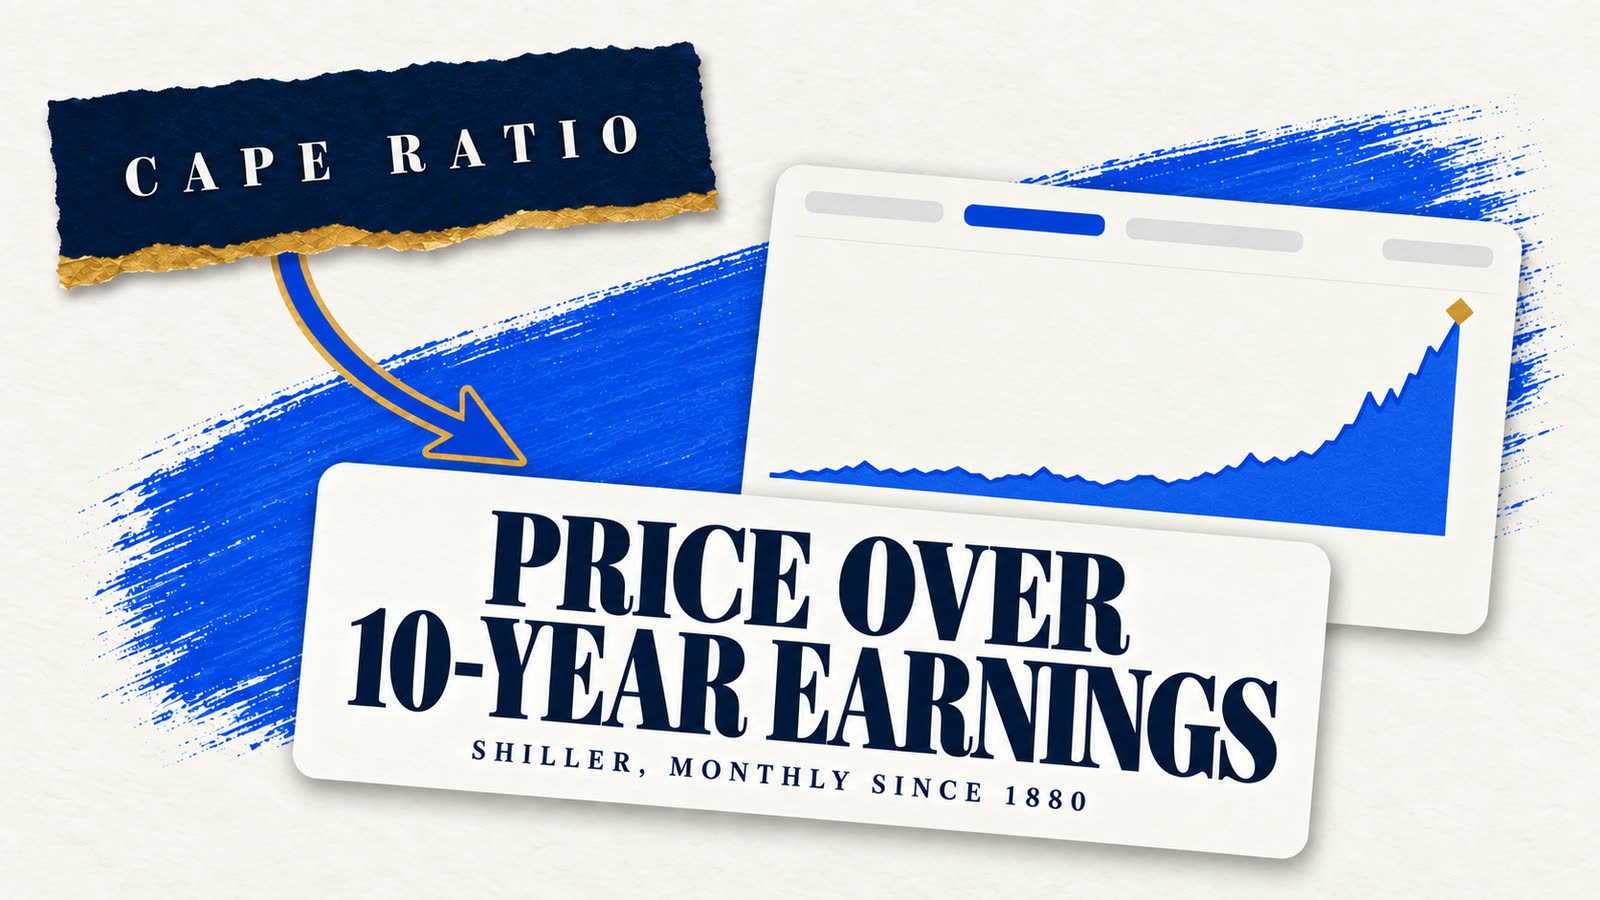
CAPE divides the real price of the S&P Composite by the average of its real earnings over the preceding ten years. The ten-year average is the entire idea. A single year of earnings collapses in a recession and spikes in a boom, so an ordinary price-to-earnings ratio reports a market as most expensive at the bottom of a cycle, which is exactly backwards. In 2009 trailing earnings briefly took the S&P's plain P/E above 120 while CAPE read about 13, and CAPE was the one telling the truth.
Robert Shiller published the construction and the underlying data, which is why this page can be built at all. Both halves are adjusted for inflation using the same price index, so the ratio carries no base year and a reading from 1920 is directly comparable with one from today. The reciprocal is the earnings yield, which is the more intuitive framing for some readers: a CAPE of 40 is an earnings yield of 2.5%, meaning the index earns two and a half cents a year for every dollar it costs.
It is not a market timing signal and the record is blunt about that. High readings have persisted for years before resolving, and the last time the ratio went above 40 it stayed there for a long stretch. What the measure supports is an expectation about a decade, held loosely, with a wide range around it. That is less satisfying than a prediction and it is what the data actually carries.
Where this goes wrong
Four ways to misread the number on the panel
Treating the median as the forecast
It is the middle of a group of historical decades, not a projection. Half of the decades in any band came in below it, and the worst case on the panel is as real as the median beside it.
Reading a thin band as if it were thick
The expensive end of the record is a few dozen months drawn from a small number of episodes, mostly clustered in time. A median over that is a description of those episodes rather than a general law.
Using it to time a decision this month
CAPE explains a decade loosely and a year almost not at all. Nothing on this page is a reason to buy or sell anything this week, and a high reading has persisted for years before resolving.
Forgetting what comes out before you see it
These are gross returns. Tax, fund fees, trading costs and, for metal, a dealer spread all come out first. A real outcome sits below these figures by whatever those cost you.
Related
More market valuation tools and trackers
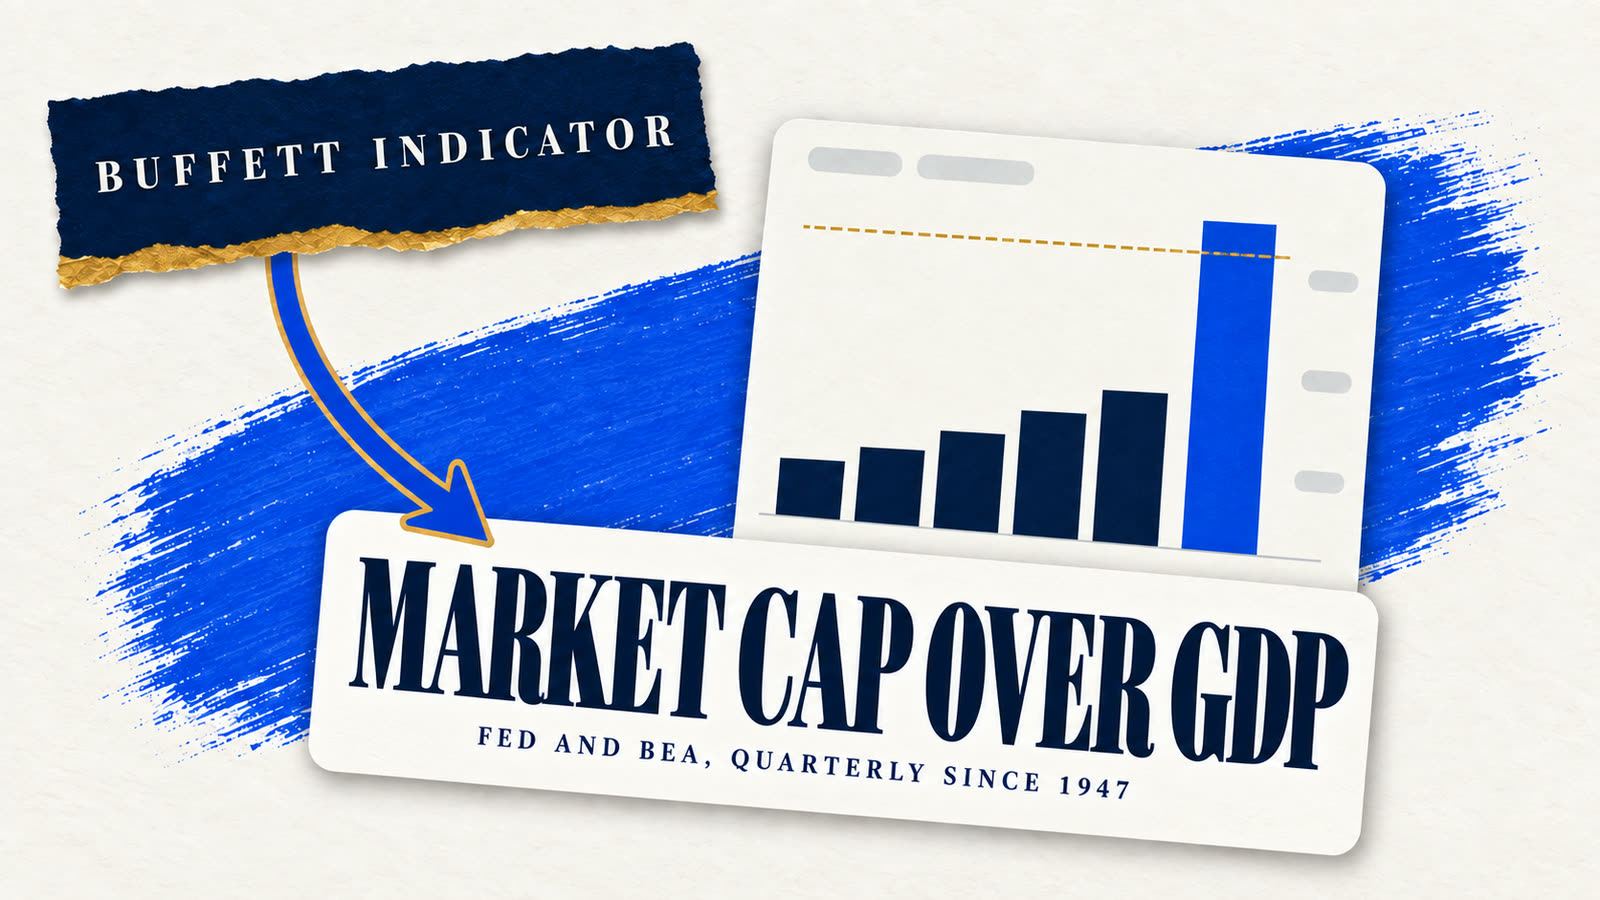
The full record behind this calculator, the other valuation measure, and what acting on either would cost.
Common questions
CAPE calculator questions
- Is this a prediction of what my money will do?
- No. It is a lookup of what already happened. The calculator finds every month since 1881 that began at the CAPE you selected, measures the real total return of the ten years that followed, and reports the middle and the two ends of that group. No return is assumed and nothing is forecast, which is why the worst case sits beside the median at the same size.
- What does the CAPE ratio predict?
- The next decade's real total return, loosely, with a wide range around it. From today's reading of 40.1 the band holds 56 months, the median decade returned -1.27% a year after inflation, and the worst returned -5.9%. Over a single year the relationship is close to useless, which is why the horizon here is fixed at ten years.
- Why ten years and not five or twenty?
- Ten is the horizon the relationship actually holds over and it is the window Shiller's own construction uses for earnings. Shorter windows are dominated by sentiment and the signal disappears. Much longer windows leave too few independent observations in the record to say anything, because overlapping thirty-year periods share most of their data.
- Are dividends included?
- Yes, reinvested, and it matters more than most people expect. Dividends were the larger half of US equity return for much of this record and they are highest exactly when valuations are lowest, so a price-only version would steepen the relationship this calculator shows and flatter the argument. Returns are also real, meaning inflation has been removed.
- Why does a high CAPE not just mean sell?
- Because a level has never been a timing signal on this series. Readings have stayed high for years before resolving, and the band immediately below today's is not reliably worse than the one below that. What the record supports is a lower expected return over a decade, held loosely. Acting on it as a trigger is using the measure for the one thing the evidence says it cannot do.
- Does this account for fees and tax?
- No, and real outcomes come in below these figures by whatever those cost you. The returns here are gross: no fund fee, no trading cost, no tax, and for anyone comparing against metal, no dealer spread. On a gold IRA specifically the spread over spot is paid once on the way in and is locked into the position for as long as you hold it.
If the number moved you
A lower expected return is not an argument for any particular asset
What this calculator supports is a lower expected return from US equities over a decade than the last fifteen years delivered. It says nothing about what to hold instead, and a sales call will run the two together. The gold case has to be made on its own record, which is a separate page and a separate set of numbers.
Source: Robert Shiller's online data for price, earnings and CPI. Returns are real, include reinvested dividends, and exclude tax, trading costs and fees. Full dataset as CSV. Past performance does not predict future results. Gold IRA Digest is an independent publisher and this page is information, not investment advice.